blog review 第四期
看tag知内容
Avoiding instruction cache misses

针对流程来做优化方案,编译器也有对应的支持,代码标注,[[likely]] [[unlikely]] [[cold]] [[hot]],还有inline之类的。讲的范范,简单了解
Deadlock prevention algorithms
PacificA 微软设计的分布式存储框架
How we implemented Distributed Multi-document ACID Transactions in Couchbase
MySQL协议分析
Mysql 通讯协议
半双工,数据编码/命令编码

整型编码
整型值编码又分为两类:定长整型值(FixedLengthInteger)、带长度编码的整型值(LengthEncodedInteger)。
定长整型值其实就是将一个数值编码存放到适当个数的字节中,主要有 int<1>、int<2>、int<3>、int<4>、int<6>、int<8>。 分别对应 1、2、3、4、6、8 个字节长度的整型数值。这些整型值都采用小端字节序来存储。例如:一个值为 1 int<3> 的整数值, 它的编码:
01 00 00。协议包头的 payload length 就是一个 int<3> 的整型值。带长度编码的整型值,通常使用 1、3、4、9 个字节来存储数据,它会根据数字的大小选择合适的字节数来编码存储。 一般用在数据字段,例如,查询返回的结果集合,集合中的每一行数据就是按照该方式编/解码。 它的编码规则如下:
- 如果值 < 251,则使用一个字节来存储;
- 如果值 ≥ 251 and < (2^16), 则使用 0xfc + 2-byte 来存储(3 字节);
- 如果值 ≥ (2^16) and < (2^24), 则使用 0xfd + 3-byte 来存储(4 字节);
- 如果值 ≥ (2^24) and < (2^64), 则使用 0xfe + 8-byte 来存储(9 字节);
如果数据包的第一个字节是长度编码整数,其字节值为
0xfe,则必须检查数据包的长度,以验证它是否有足够的空间容纳 8 字节整数。 如果不是,它可能是一个 EOF_packet。payload 的第一个字节的意义是依赖于上下文的。
字符串编码
字符串
字符串的字节编码方式,会稍微比整型数值复杂,主要包括:
- 定长字符串
string<fix>,类似 C 语言中的字符数组char str[10];- 以 NULL 结束的字符串
string<NUL>,类似 C 语言中的字符串char *pstr = "hello";- 变长字符串
string<var>,类似 C 语言的变长数组int num=10; char str[num];- 带长度编码的字符串,编码方式与带长度编码的整数一样(许多序列化库都是采用这种方式,例如:msgpack)
- 剩余字符串
string<EOF>前面 4 种编码都比较好理解,第 5 种字符串编码可能会有些迷惑,其实也很简单, 如果字符串是数据包(playload)的最后一部分,则可以从总数据包长度减去当前位置来计算其长度。 它符合下面的公式:
字符串长度 = playload 长度 - payload 当前偏移
参考资料 https://dev.mysql.com/doc/internals/en/client-server-protocol.html
这两篇文档可以用来做filter支撑
Enforcing Signatures On Templated Callbacks
好像又写了个function_ref
Pin and suffering
手把手教你写async rust
Deadlock prevention algorithms
建议直接看<事务处理概念与技术>这本书,这个博客就是介绍几种死锁处理手段 wait-die/Wound-wait/Immediate restart/Running priority
4.1 等待-死亡方案(Wait-die Scheme)
该方案是基于非剥夺方法。当进程Pi请求的资源正被进程Pj占有时,只有当Pi的时间戳比进程Pj的时间戳小时,即Pi比Pj老时,Pi才能等待。否则Pi被卷回(roll-back),即死亡。一个进程死亡后会释放他所占用的所有资源。在这里假定死亡的进程将带着同样的时间戳重新运行。由于具有较小时间戳的进程才等待具有较大时间戳的进程,因此很显然死锁不会发生。当进程在等待特定的资源时,不会释放资源。一旦一个进程释放一个资源,与这个资源相联系的等待队列中的一个进程将被激活。 4.2 伤害-等待方案(Wound-wait Scheme)
它是一种基于剥夺的方法。当进程Pi请求的资源正被进程Pj占有时,只有当进程Pi的时间戳比进程Pj的时间戳大时,即Pi比Pj年轻时,Pi才能等待。否则Pj被卷回(roll-back),即死亡。只要被卷回的进程重新启动时,使用原有的时间戳,这两种方案都能避免死锁和饿死现象。由于时间戳总是增加的,被卷回的进程最终将具有最小的时间戳。 ———————————————— 版权声明:本文为CSDN博主「辗转盘山」的原创文章,遵循CC 4.0 BY-SA版权协议,转载请附上原文出处链接及本声明。 原文链接:https://blog.csdn.net/wxl612/article/details/53008579
Examining Problematic Memory in C/C++ Applications with BPF, perf, and Memcheck
几个检查内存问题的工具/方法
#memcheck
valgrind --leak-check=full --track-origins=yes --xtree-memory=full --xtree-memory-file=leaks.kcg ./LoopLeak.out
# callgrind_annotate
callgrind_annotate leaks.kcg leak.c
内存观测

perf观测

bpf观测

定位问题命令行
| Question | Tool | Answer |
|---|---|---|
| How much memory is currently free/used? | free -m | At the time of execution, there was some memory left. However, sar -r reveals continuous drops of available memory – soon to cross into swap space. |
| How was/is memory used? | sar -r | Continuous decrease of available memory. |
| How much memory is each process using? | top -o %MEM | XOREncryptor hogs the majority of available memory. |
| How much of our swap space is used? | sar -S | sar -S shows a continuous increase of swap space capacity. This is an indication that the system has run out of available memory and is forced to page out memory to swap space. |
| How much memory is swapped in/out? | vmstat | vmstat shows increases of virtual memory, and that a single process is forcing the system to swap pages to disk. The report also shows signs of thrashing. |
| How many page faults is the system encountering per second? | sar -B | Running sar -B for an extended period of time shows the increase of memory reclaims, page outs to disk, and general hardship in keeping up to the memory demand. |
| Were any processes killed by the out-of-memory manager? | dmesg | XOREncryptor was eventually killed by the OOM killer. |
内存问题
| What | Why | Memory Event |
|---|---|---|
| Heap expansion | Capturing a stack trace that led up to heap expansion would reveal why the heap was expanded. | brk() |
| Large allocations | Larger allocations are often contracted to mmap as opposed to malloc() for efficiency reasons. Tracing mmap() would reveal events that led up to large allocations. | mmap() |
| Major & minor page faults | Often cheaper to trace than malloc(), and would give us an idea as to why page faults are triggered so frequently in the workload application. | page-faults, major-page-faults |
用perf抓brk
# perf stat -e syscalls:sys_enter_brk -I 1000 -a
1.000122133                  3      syscalls:sys_enter_brk
2.000984485                  0      syscalls:sys_enter_brk
# perf record -e syscalls:sys_enter_brk -a -g -- sleep 30
# perf script > out.stacks
./stackcollapse-perf.pl < out.stacks | ./flamegraph.pl --color=mem  --title="Heap Expansion Flame Graph" --countname="calls" > out.svg
用bcc抓brk
# bpftrace -e 'tracepoint:syscalls:sys_enter_brk { @[ustack, comm] = count(); }' > out.stacks
 # ./stackcollapse-bpftrace.pl < out.stacks | ./flamegraph.pl --color=mem --title="Heap Expansion Flame Graph" --countname="calls" > out.svg
用perf抓mmap
# perf record -e syscalls:sys_enter_mmap -a -g -- sleep 30
 # perf script > out.stacks
 # ./stackcollapse-perf.pl < out.stacks | ./flamegraph.pl --color=mem \ --title="mmap() Flame Graph" --countname="calls" > out.svg
用bpf抓mmap
 # /usr/share/bcc/tools/stackcount -f -PU t:syscalls:sys_enter_mmap > out.stacks
 # ./flamegraph.pl --hash --color=mem \ --title="mmap() Flame Graph" --countname="calls" < out.stacks > out.svg
用bpftrace抓mmap
# bpftrace -e 'tracepoint:syscalls:sys_enter_mmap { @[ustack, comm] = count(); }'
 # ./stackcollapse-bpftrace.pl < out.stacks | ./flamegraph.pl --color=mem --title="mmap() Flame Graph" --countname="calls" > out.svg
用perf抓page fault
# perf record -e page-faults -a -g -- sleep 30
# perf script > out.stacks
# ./stackcollapse-perf.pl < out.stacks | ./flamegraph.pl --color=mem \ --title="Page Faults" --countname="pages" > out.svg
用bcc抓page fault
# /usr/share/bcc/tools/stackcount -f -PU t:exceptions:page_fault_user > out.stacks
# ./flamegraph.pl --hash --color=mem \ --title="Page Faults" --countname="pages" < out.stacks > out.svg
用bfptrace抓page fault
# bpftrace -e 'tracepoint:exceptions:page_fault_user { @[ustack, comm] = count(); }' > out.stacks
# ./stackcollapse-bpftrace.pl < out.stacks | ./flamegraph.pl --color=mem --title="Page Faults" --countname="pages" > out.svg
Finding Bytes in Arrays
做了个benchmark,讨论解析bison如何判断结尾以及哪种方法最快,条件判断/去掉条件判断的branch-free方法/向量化,结果是向量化吞吐最高, 分支判断最慢
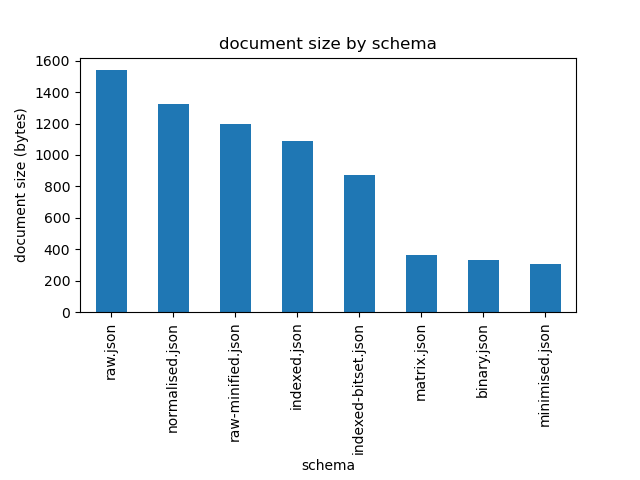
Shrinking BSON Documents
一个bson,用于保存属性名字的空间占用非常多(属性名字经常重复) ,给了几个压缩方案,以及结果对比
- Shrinking Attributes 直接把字段名字改成单个字符,省了一点
- Normalisation 重复字段提升到上一层 省了一点
- Inverted Tags Index将tag抽象成bitmap
- 上面的index bitmap改成Binary Tag Format
- Factorisation 把其他字段也类似的用数组抽象起来
- Binary Values Array 把值数组直接改成binary
- 和第一点结合,改成短字符,省了一点
下图是对比,第一个是基线,可以看出提升非常明显